集群会话大量掉线

一、集群基础环境

  1. EMQX 版本:5.7.1 社区版
  2. 集群架构:4 Core 核心节点 + 13 Replicant 副本节点,总在线客户端 250 万,连接均匀分摊所有节点
  3. 业务场景:平台划分 198 个套餐包独立主题,每台设备仅订阅自身所属套餐主题,全部订阅 QoS=2;服务端一次性向全部 198 个套餐主题同步发布广播消息,下发期间集群批量掉线约 50 万终端,广播全部下发完成后掉线设备自动重连。
  4. 当前状态:无任何内存高水位告警,整机内存占用持续低于 70% 水位阈值,排除内存保护机制主动踢会话的诱因。
  5. 初始配置:MQTT 会话、保留消息均为出厂默认参数,未做下行流量、QoS 队列、集群 RPC 限流优化。

二、故障完整现象

  1. 触发条件:一次性批量发布全部 198 个套餐主题广播必现;拆分主题分批推送、拉长发布间隔后,掉线数量明显下降;
  2. 掉线范围:Core、Replicant 全部节点同步大批量断开客户端,并非单节点局部故障;
  3. 资源特征:批量发布瞬间,所有节点 CPU、网卡出口 TX 流量同步冲高;监控面板Pending Messages(QoS 待确认报文)瞬时暴涨;
  4. 无内存相关告警,可确认不是内存超限触发 EMQX 主动回收会话。

三、Core/Replicant 集群架构放大故障原理

  1. Core 节点职责:全局 Mnesia 分布式元数据表(订阅、会话、QoS2 待确认状态)唯一存储节点;
  2. Replicant 节点职责:仅承载客户端长连接,无本地元数据存储,所有 QoS2 握手状态变更、订阅匹配都需要远程 RPC 访问 Core 节点;
  3. 本次故障架构放大逻辑:一次性同时推送 198 个主题广播,海量 QoS2 四步握手报文(PUBLISH/PUBREC/PUBREL/PUBCOMP)产生巨量跨节点 RPC 请求;13 个 Replicant 节点同步压向 4 个 Core 节点,Core 节点 RPC 队列打满、Mnesia 全局锁严重竞争,会话状态读写阻塞;Replicant 无法及时更新客户端会话状态,会话判定失效断开,最终表现全集群同步批量掉线。

四、当前默认配置清单

1. MQTT 会话出厂默认配置

  • 最大飞行窗口 max_inflight = 32
  • 最大待发 PUBREL 数量 max_awaiting_rel = 1000
  • 最大消息队列长度 max_mqueue_len = 1000
  • 消息重试间隔 30s,PUBREL 等待超时 30s

2. 保留消息出厂默认配置

  • 保留消息全局开启,存储模式ram内存存储
  • 最大保留消息数量:无上限限制,无自动过期清理
  • 保留消息派发速率:1000 条 / 秒

3. 内存水位配置

vm.high_watermark = 70%,业务峰值内存始终低于阈值,不会触发内存保护踢会话。

这现像看起来更像一次性 QoS2 广播把下行、client/session 进程和 Core/Replicant 分布式通道一起打满了。

分批/拉长间隔后掉线明显下降,说明是 burst 过载;Pending Messages 暴涨、CPU/TX 同步冲高,说明 QoS1/QoS2 下行未确认消息在峰值堆起来了。

  1. 广播不要一次性发完 198 个主题。发布端做批次和限速,每批发完等 Pending Messages、messages.qos2.sentmessages.ackeddelivery.dropped.* 回落再继续。
  2. 如果业务能接受,广播类消息改 QoS 1,甚至 QoS 0 + 业务侧去重。QoS 2 在 250 万客户端广播场景会把每个客户端的确认链路都放大一遍。
  3. 不需要调大 max_inflight / max_mqueue_len 。如果每台设备只订阅一个套餐主题,单客户端大概率只有 1 条 pending,但全集群同时有百万级 QoS2 pending。盲目调大只会把背压变成更大的内存/邮箱压力。
  4. 不像是 retained 消息导致的。除非这些广播是 retained 消息,或大量客户端在同一时间重连/订阅触发 retained 派发。

现在需要定位是 force shutdown、socket 背压还是 Core 分布式通道的原因?

# 所有节点,峰值前/峰值中/恢复后各一次
emqx ctl broker stats
emqx ctl broker metrics

# 抽样看客户端会话队列和 QoS2 pending
emqx ctl clients stats --file /tmp/clients.csv

# Core/Replicant 状态
emqx ctl eval 'mria_rlog:status().'

同时在日志里搜:

grep -E 'mailbox_overflow|force_shutdown|busy_port|busy_dist_port|long_schedule|large_heap|keepalive_timeout|tcp_closed' emqx.log*

如果可以断线的原因已经落到 DB 了,先把断连原因按节点聚合:

SELECT reason, node, count(*) as cnt
FROM "$events/client/disconnected"
GROUP BY reason, node

一些基本判断:

  • mailbox_overflow / force_shutdown 多:client/session 进程邮箱被广播打爆,先降发布速率;临时调大 mqtt.force_shutdown.max_mailbox_size 只能缓解,长期不能靠这个。
  • busy_port 多:socket 出口或客户端消费慢,开慢订阅统计,按 clientId/topic 找慢客户端群。
  • busy_dist_portemqx_mria_* 队列增长:Core 与 Replicant 分布式通道也被压满,需要降低瞬时广播、增强 Core/节点间网络/node.dist_buffer_size,再评估 Core 数量。
  • keepalive_timeout 多:调度或网络拥塞导致心跳处理延迟,不是客户端主动掉线。

这类场景的核心还是削峰:发布端限速 + QoS 降级/业务去重 + 复现时按 disconnected reason 和 sysmon/mria 指标定点调。

PS: v6 的 core+replicant 做了更多的优化,稳定性应该是一个数量级的差距。像你们这么大的量,其实可以考虑升级一下的。

我这边17个节点 每个节点会话才15万呢,为啥会client/session 进程和 Core/Replicant 分布式通道一起打满呢

怎么判断 是因为client/session 进程和 Core/Replicant 分布式通道一起打满了呢

目前只是我个人觉得更像,所以需要再复现拿到更多的证据(指标和日志)。

没必要搞那么多节点,可以先试试让每个节点会话 30 万,(我觉得 50 万都无所谓)

正常250万会话的时候
./emqx ctl broker stats
channels.count : 157518
channels.max : 159046
cluster_sessions.count : 2606043
cluster_sessions.max : 2695721
connections.count : 157518
connections.max : 159046
delayed.count : 0
delayed.max : 4
durable_subscriptions.count : 0
durable_subscriptions.max : 0
live_connections.count : 157518
live_connections.max : 159046
retained.count : 35
retained.max : 35
sessions.count : 157518
sessions.max : 159046
suboptions.count : 472543
suboptions.max : 477121
subscribers.count : 621496
subscribers.max : 625507
subscriptions.count : 472543
subscriptions.max : 477121
subscriptions.shared.count : 4
subscriptions.shared.max : 34
topics.count : 9061
topics.max : 9403

./emqx ctl broker metrics
authentication.failure : 1623467611
authentication.success : 15050565
authentication.success.anonymo: 125584
authorization.allow : 44902538
authorization.cache_hit : 2963
authorization.cache_miss : 419046816
authorization.deny : 374147241
authorization.matched.allow : 44893531
authorization.matched.deny : 374146370
authorization.nomatch : 0
authorization.superuser : 6915
bytes.received : 338860858057
bytes.sent : 50253176860
client.auth.anonymous : 125584
client.authenticate : 1638518176
client.authorize : 419046816
client.connack : 3236353651
client.connect : 3236353651
client.connected : 15050036
client.disconnected : 14892521
client.subscribe : 14932429
client.unsubscribe : 5
delivery.dropped : 0
delivery.dropped.expired : 0
delivery.dropped.no_local : 0
delivery.dropped.qos0_msg : 0
delivery.dropped.queue_full : 0
delivery.dropped.too_large : 0
messages.acked : 6868833
messages.delayed : 104
messages.delivered : 20139942
messages.dropped : 95435
messages.dropped.await_pubrel_: 0
messages.dropped.no_subscriber: 95432
messages.forward : 152679
messages.persisted : 0
messages.publish : 105330
messages.qos0.received : 374242448
messages.qos0.sent : 0
messages.qos1.received : 0
messages.qos1.sent : 0
messages.qos2.received : 10024
messages.qos2.sent : 20139931
messages.received : 374252472
messages.sent : 20139931
messages.transformation_failed: 0
messages.transformation_succee: 0
messages.validation_failed : 0
messages.validation_succeeded : 0
overload_protection.delay.ok : 0
overload_protection.delay.time: 0
overload_protection.gc : 0
overload_protection.hibernatio: 0
overload_protection.new_conn : 0
packets.auth.received : 0
packets.auth.sent : 0
packets.connack.auth_error : 3221303086
packets.connack.error : 3221303615
packets.connack.sent : 3236353651
packets.connect.received : 3236354444
packets.disconnect.received : 4031
packets.disconnect.sent : 0
packets.pingreq.received : 15716813264
packets.pingresp.sent : 15716813264
packets.puback.inuse : 0
packets.puback.missed : 0
packets.puback.received : 0
packets.puback.sent : 0
packets.pubcomp.inuse : 0
packets.pubcomp.missed : 10274317
packets.pubcomp.received : 16577566
packets.pubcomp.sent : 9921
packets.publish.auth_error : 0
packets.publish.dropped : 3
packets.publish.error : 0
packets.publish.inuse : 0
packets.publish.received : 374252472
packets.publish.sent : 20139931
packets.pubrec.inuse : 5285395
packets.pubrec.missed : 0
packets.pubrec.received : 12154228
packets.pubrec.sent : 10021
packets.pubrel.missed : 0
packets.pubrel.received : 9921
packets.pubrel.sent : 22157597
packets.received : 19371098360
packets.sent : 19010416819
packets.suback.sent : 14932429
packets.subscribe.auth_error : 0
packets.subscribe.error : 0
packets.subscribe.received : 14932429
packets.unsuback.sent : 5
packets.unsubscribe.error : 0
packets.unsubscribe.received : 5
session.created : 15050036
session.discarded : 1047673
session.resumed : 0
session.takenover : 0
session.terminated : 13844848

有客户端掉线的时候(执行这个语句会卡一会)
./emqx ctl broker metrics
authentication.failure : 1623476161
authentication.success : 15067736
authentication.success.anonymo: 125584
authorization.allow : 44954186
authorization.cache_hit : 2963
authorization.cache_miss : 419127587
authorization.deny : 374176364
authorization.matched.allow : 44944996
authorization.matched.deny : 374175493
authorization.nomatch : 0
authorization.superuser : 7098
bytes.received : 338878736817
bytes.sent : 50321062487
client.auth.anonymous : 125584
client.authenticate : 1638543897
client.authorize : 419127587
client.connack : 3236444959
client.connect : 3236444959
client.connected : 15067207
client.disconnected : 14915279
client.subscribe : 14949584
client.unsubscribe : 5
delivery.dropped : 0
delivery.dropped.expired : 0
delivery.dropped.no_local : 0
delivery.dropped.qos0_msg : 0
delivery.dropped.queue_full : 0
delivery.dropped.too_large : 0
messages.acked : 7007038
messages.delayed : 105
messages.delivered : 20378504
messages.dropped : 95441
messages.dropped.await_pubrel_: 0
messages.dropped.no_subscriber: 95438
messages.forward : 155465
messages.persisted : 0
messages.publish : 105513
messages.qos0.received : 374271571
messages.qos0.sent : 0
messages.qos1.received : 0
messages.qos1.sent : 0
messages.qos2.received : 10207
messages.qos2.sent : 20378493
messages.received : 374281778
messages.sent : 20378493
messages.transformation_failed: 0
messages.transformation_succee: 0
messages.validation_failed : 0
messages.validation_succeeded : 0
overload_protection.delay.ok : 0
overload_protection.delay.time: 0
overload_protection.gc : 0
overload_protection.hibernatio: 0
overload_protection.new_conn : 0
packets.auth.received : 0
packets.auth.sent : 0
packets.connack.auth_error : 3221377223
packets.connack.error : 3221377752
packets.connack.sent : 3236444959
packets.connect.received : 3236445752
packets.disconnect.received : 4031
packets.disconnect.sent : 0
packets.pingreq.received : 15717714043
packets.pingresp.sent : 15717714043
packets.puback.inuse : 0
packets.puback.missed : 0
packets.puback.received : 0
packets.puback.sent : 0
packets.pubcomp.inuse : 0
packets.pubcomp.missed : 10362238
packets.pubcomp.received : 16797874
packets.pubcomp.sent : 10104
packets.publish.auth_error : 0
packets.publish.dropped : 3
packets.publish.error : 0
packets.publish.inuse : 0
packets.publish.received : 374281778
packets.publish.sent : 20378493
packets.pubrec.inuse : 5338389
packets.pubrec.missed : 0
packets.pubrec.received : 12345427
packets.pubrec.sent : 10204
packets.pubrel.missed : 0
packets.pubrel.received : 10104
packets.pubrel.sent : 22393216
packets.received : 19372548598
packets.sent : 19011900606
packets.suback.sent : 14949582
packets.subscribe.auth_error : 0
packets.subscribe.error : 0
packets.subscribe.received : 14949584
packets.unsuback.sent : 5
packets.unsubscribe.error : 0
packets.unsubscribe.received : 5
session.created : 15067207
session.discarded : 1047838
session.resumed : 0
session.takenover : 0
session.terminated : 13867441

./emqx ctl broker stats
channels.count : 157313
channels.max : 159046
cluster_sessions.count : 2604559
cluster_sessions.max : 2695721
connections.count : 157313
connections.max : 159046
delayed.count : 1
delayed.max : 4
durable_subscriptions.count : 0
durable_subscriptions.max : 0
live_connections.count : 157313
live_connections.max : 159046
retained.count : 35
retained.max : 35
sessions.count : 157313
sessions.max : 159046
suboptions.count : 471928
suboptions.max : 477121
subscribers.count : 620761
subscribers.max : 625507
subscriptions.count : 471928
subscriptions.max : 477121
subscriptions.shared.count : 4
subscriptions.shared.max : 34
topics.count : 9061
topics.max : 9403

日志中有
2026-07-08T21:02:29.155468+08:00 [warning] msg: busy_port, portinfo: [{port,#Port<0.3311877717>},{name,“tcp_inet”},{links,[<0.233467095.14>]},{id,651947},{connected,<0.233467095.14>},{input,0},{output,28155133},{os_pid,undefined}], procinfo: [{pid,<0.132720297.12>},{memory,36864},{total_heap_size,3854},{heap_size,987},{stack_size,25},{min_heap_size,233},{proc_lib_initial_call,{rabbit_writer,enter_mainloop,[‘Argument__1’,‘Argument__2’]}},{initial_call,{proc_lib,init_p,5}},{current_stacktrace,[{erlang,port_command,3,},{prim_inet,send,5,},{rabbit_net,gen_tcp_send,2,[{file,“rabbit_net.erl”},{line,192}]},{rabbit_writer,port_cmd,2,[{file,“rabbit_writer.erl”},{line,418}]},{rabbit_writer,internal_flush,1,[{file,“rabbit_writer.erl”},{line,396}]},{rabbit_writer,handle_message,3,[{file,“rabbit_writer.erl”},{line,232}]},{rabbit_writer,mainloop1,2,[{file,“rabbit_writer.erl”},{line,223}]},{rabbit_writer,mainloop,2,[{file,“rabbit_writer.erl”},{line,207}]}]},{registered_name,},{status,suspended},{message_queue_len,79},{group_leader,<0.152121585.14>},{priority,normal},{trap_exit,false},{reductions,560051},{last_calls,false},{catchlevel,3},{trace,0},{suspending,},{sequential_trace_token,},{error_handler,error_handler}]

2026-07-08T21:02:29.873086+08:00 [warning] msg: busy_port, portinfo: [{port,#Port<0.3648129157>},{name,“tcp_inet”},{links,[<0.84970801.11>]},{id,17449},{connected,<0.84970801.11>},{input,0},{output,31366860},{os_pid,undefined}], procinfo: [{pid,<0.237709936.14>},{memory,29896},{total_heap_size,3082},{heap_size,1598},{stack_size,25},{min_heap_size,233},{proc_lib_initial_call,{rabbit_writer,enter_mainloop,[‘Argument__1’,‘Argument__2’]}},{initial_call,{proc_lib,init_p,5}},{current_stacktrace,[{erlang,port_command,3,},{prim_inet,send,5,},{rabbit_net,gen_tcp_send,2,[{file,“rabbit_net.erl”},{line,192}]},{rabbit_writer,port_cmd,2,[{file,“rabbit_writer.erl”},{line,418}]},{rabbit_writer,internal_flush,1,[{file,“rabbit_writer.erl”},{line,396}]},{rabbit_writer,handle_message,3,[{file,“rabbit_writer.erl”},{line,232}]},{rabbit_writer,mainloop1,2,[{file,“rabbit_writer.erl”},{line,223}]},{rabbit_writer,mainloop,2,[{file,“rabbit_writer.erl”},{line,207}]}]},{registered_name,},{status,suspended},{message_queue_len,64},{group_leader,<0.152121585.14>},{priority,normal},{trap_exit,false},{reductions,636321},{last_calls,false},{catchlevel,3},{trace,0},{suspending,},{sequential_trace_token,},{error_handler,error_handler}]
2026-07-08T21:02:30.695593+08:00 [warning] msg: busy_port, portinfo: [{port,#Port<0.3696676121>},{name,“tcp_inet”},{links,[<0.147855812.14>]},{id,420043},{connected,<0.147855812.14>},{input,0},{output,30629913},{os_pid,undefined}], procinfo: [{pid,<0.70056426.14>},{memory,23000},{total_heap_size,2418},{heap_size,987},{stack_size,25},{min_heap_size,233},{proc_lib_initial_call,{rabbit_writer,enter_mainloop,[‘Argument__1’,‘Argument__2’]}},{initial_call,{proc_lib,init_p,5}},{current_stacktrace,[{erlang,port_command,3,},{prim_inet,send,5,},{rabbit_net,gen_tcp_send,2,[{file,“rabbit_net.erl”},{line,192}]},{rabbit_writer,port_cmd,2,[{file,“rabbit_writer.erl”},{line,418}]},{rabbit_writer,internal_flush,1,[{file,“rabbit_writer.erl”},{line,396}]},{rabbit_writer,handle_message,3,[{file,“rabbit_writer.erl”},{line,232}]},{rabbit_writer,mainloop1,2,[{file,“rabbit_writer.erl”},{line,223}]},{rabbit_writer,mainloop,2,[{file,“rabbit_writer.erl”},{line,207}]}]},{registered_name,},{status,suspended},{message_queue_len,30},{group_leader,<0.152121585.14>},{priority,normal},{trap_exit,false},{reductions,605763},{last_calls,false},{catchlevel,3},{trace,0},{suspending,},{sequential_trace_token,},{error_handler,error_handler}]
2026-07-08T21:02:31.619348+08:00 [warning] msg: busy_port, portinfo: [{port,#Port<0.3354592948>},{name,“tcp_inet”},{links,[<0.222519532.14>]},{id,538017},{connected,<0.222519532.14>},{input,0},{output,31847971},{os_pid,undefined}], procinfo: [{pid,<0.205683437.14>},{memory,1179864},{total_heap_size,136338},{heap_size,75113},{stack_size,25},{min_heap_size,233},{proc_lib_initial_call,{rabbit_writer,enter_mainloop,[‘Argument__1’,‘Argument__2’]}},{initial_call,{proc_lib,init_p,5}},{current_stacktrace,[{erlang,port_command,3,},{prim_inet,send,5,},{rabbit_net,gen_tcp_send,2,[{file,“rabbit_net.erl”},{line,192}]},{rabbit_writer,port_cmd,2,[{file,“rabbit_writer.erl”},{line,418}]},{rabbit_writer,internal_flush,1,[{file,“rabbit_writer.erl”},{line,396}]},{rabbit_writer,handle_message,3,[{file,“rabbit_writer.erl”},{line,232}]},{rabbit_writer,mainloop1,2,[{file,“rabbit_writer.erl”},{line,223}]},{rabbit_writer,mainloop,2,[{file,“rabbit_writer.erl”},{line,207}]}]},{registered_name,},{status,suspended},{message_queue_len,1015},{group_leader,<0.152121585.14>},{priority,normal},{trap_exit,false},{reductions,706192},{last_calls,false},{catchlevel,3},{trace,0},{suspending,},{sequential_trace_token,},{error_handler,error_handler}]

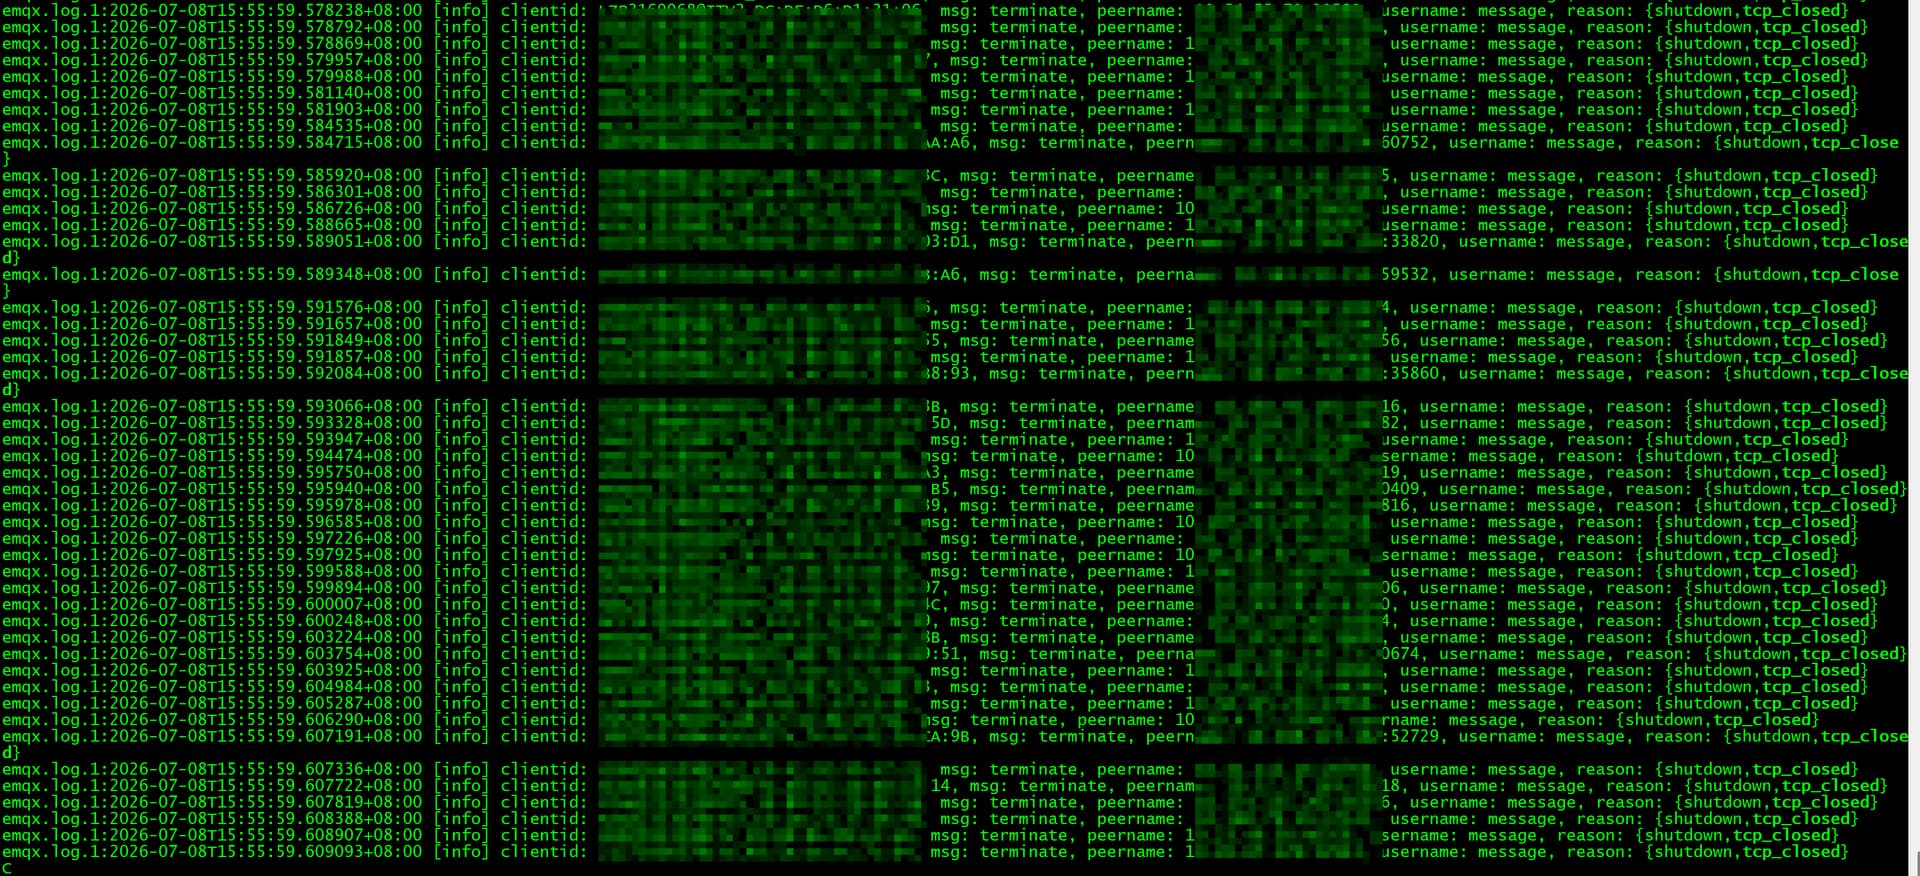
有很多这种日志

是指6.0以上的版本是吧

这次证据已经偏向 busy_port / socket 出口背压,不用看 Mnesia 全局锁。

busy_port 里的 tcp_inet + rabbit_writer + port_command/3,说明连接 writer 往客户端 TCP socket 写数据时被卡住了;output 到 28~31 MB,说明端口输出队列已经堆起来。截图里的断开原因是 {shutdown,tcp_closed},这通常是客户端或 LB 侧把 TCP 关了,不是 EMQX force_shutdown 主动踢。

“每节点 15 万连接”是瞬时 fanout。你贴的单节点 stats 里 channels.count=157518subscriptions.count=472543subscribers.count=621496,一次广播 198 个主题时,会把这些订阅对应的 QoS2 投递和确认链路一起打出来。

messages.qos2.sentpackets.pubcomp.missed 这些是运行以来累计值,不能直接当峰值证据。下一轮复现抓峰值前后增量:

date
emqx ctl broker stats
emqx ctl broker metrics | egrep 'bytes.sent|messages.qos2.sent|messages.acked|packets.pubcomp.(received|missed)|delivery.dropped|messages.dropped'
grep -E 'busy_port|busy_dist_port|force_shutdown|mailbox_overflow|tcp_closed|keepalive_timeout' log/emqx.log* | tail -200

同时开慢订阅统计,类型选 responsewhole,看是不是集中在某批 clientId/topic。如果是,就先从发布端限速、QoS2 改 QoS1/业务幂等、按主题或客户分桶削峰处理。

node.dist_buffer_size 只对 busy_dist_port 方向有帮助。现在看到的是 busy_port优先查客户端接收速度、出口带宽、LB 和发布 burst。

v6 指的是 6.0 以上的 6.x,但要不要升级可以先不管;先把 burst 和 socket 背压证据搞清楚。

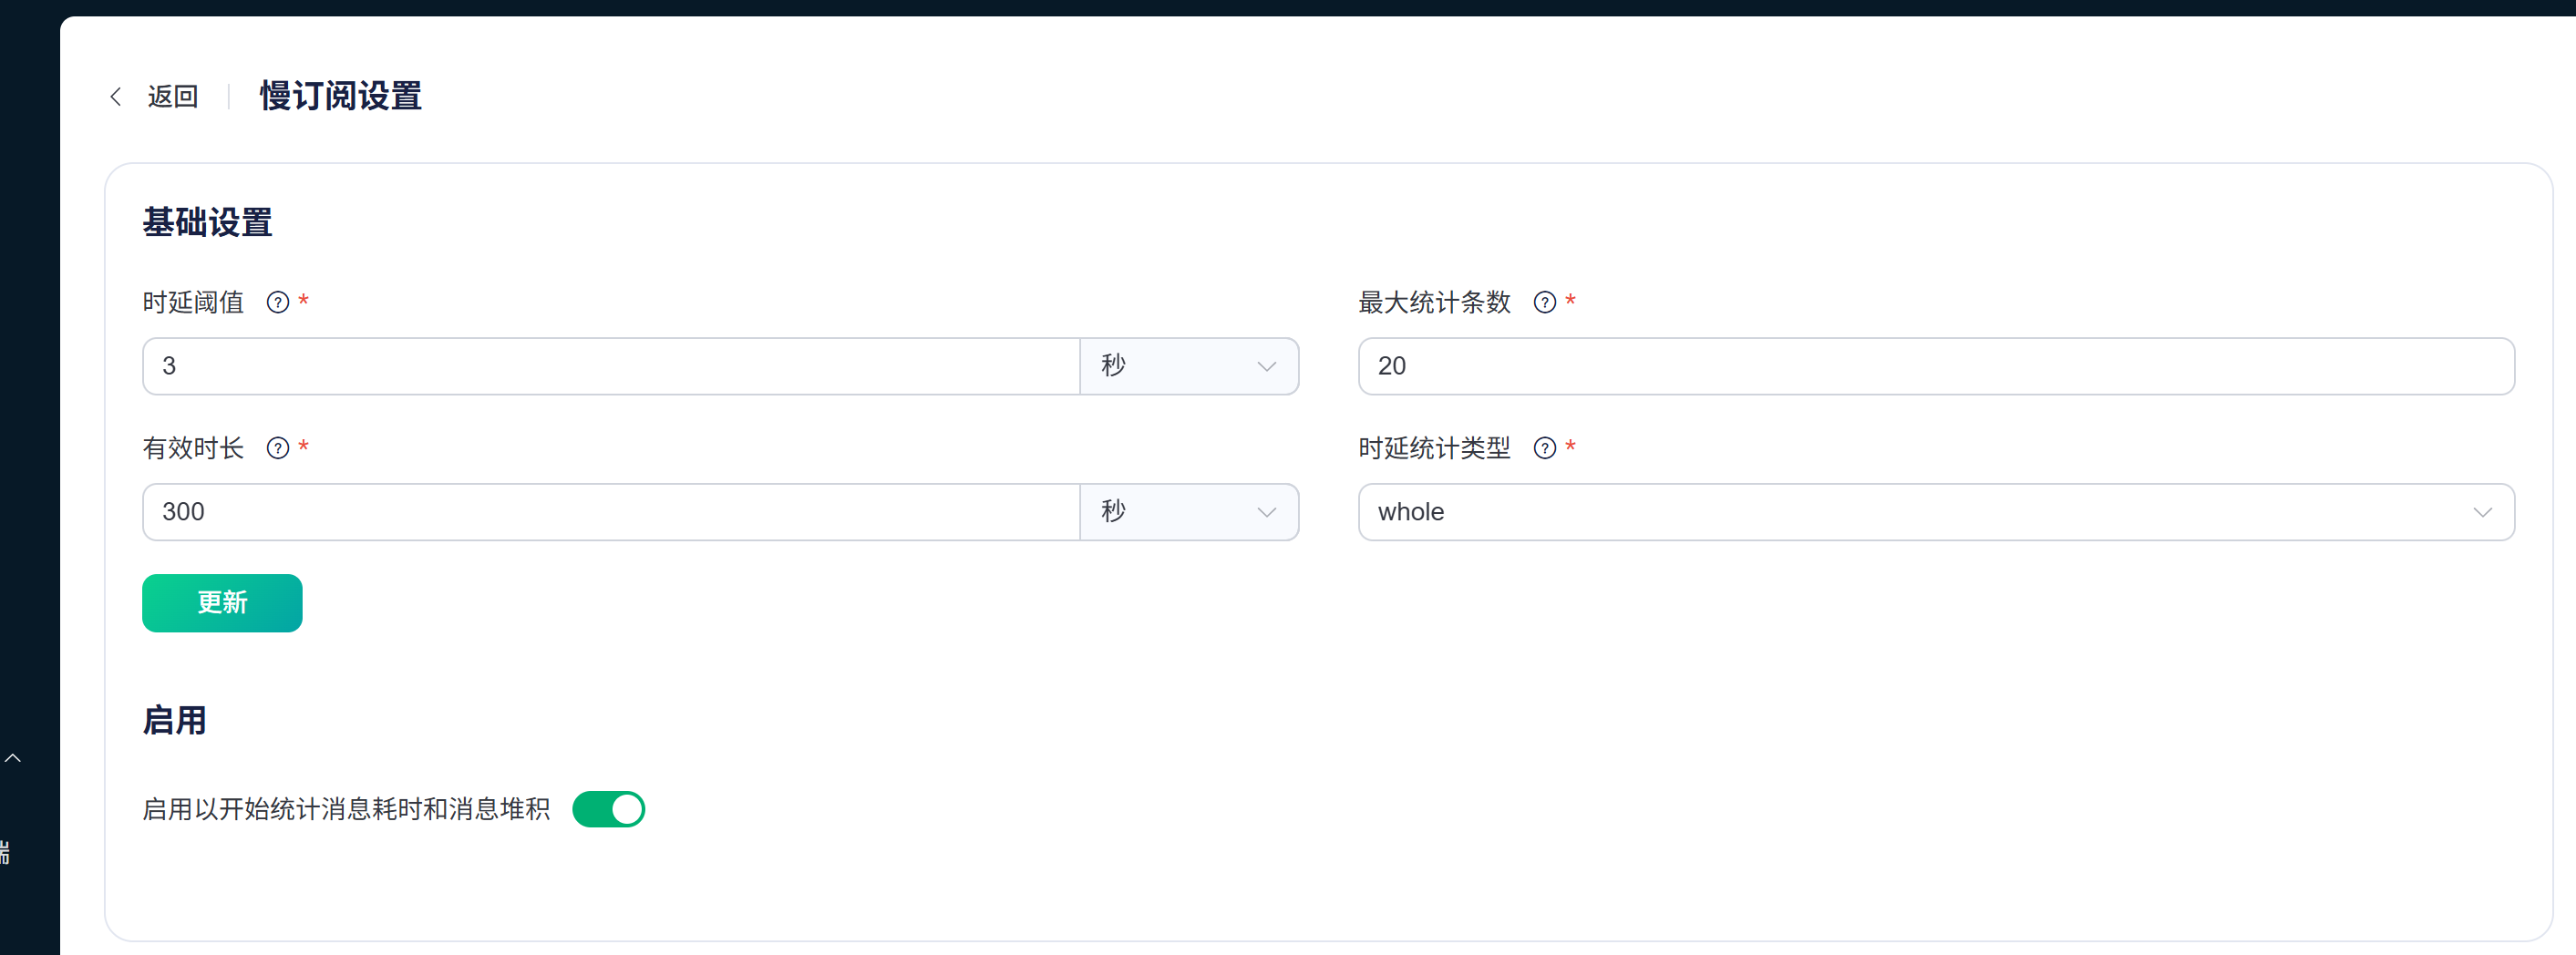
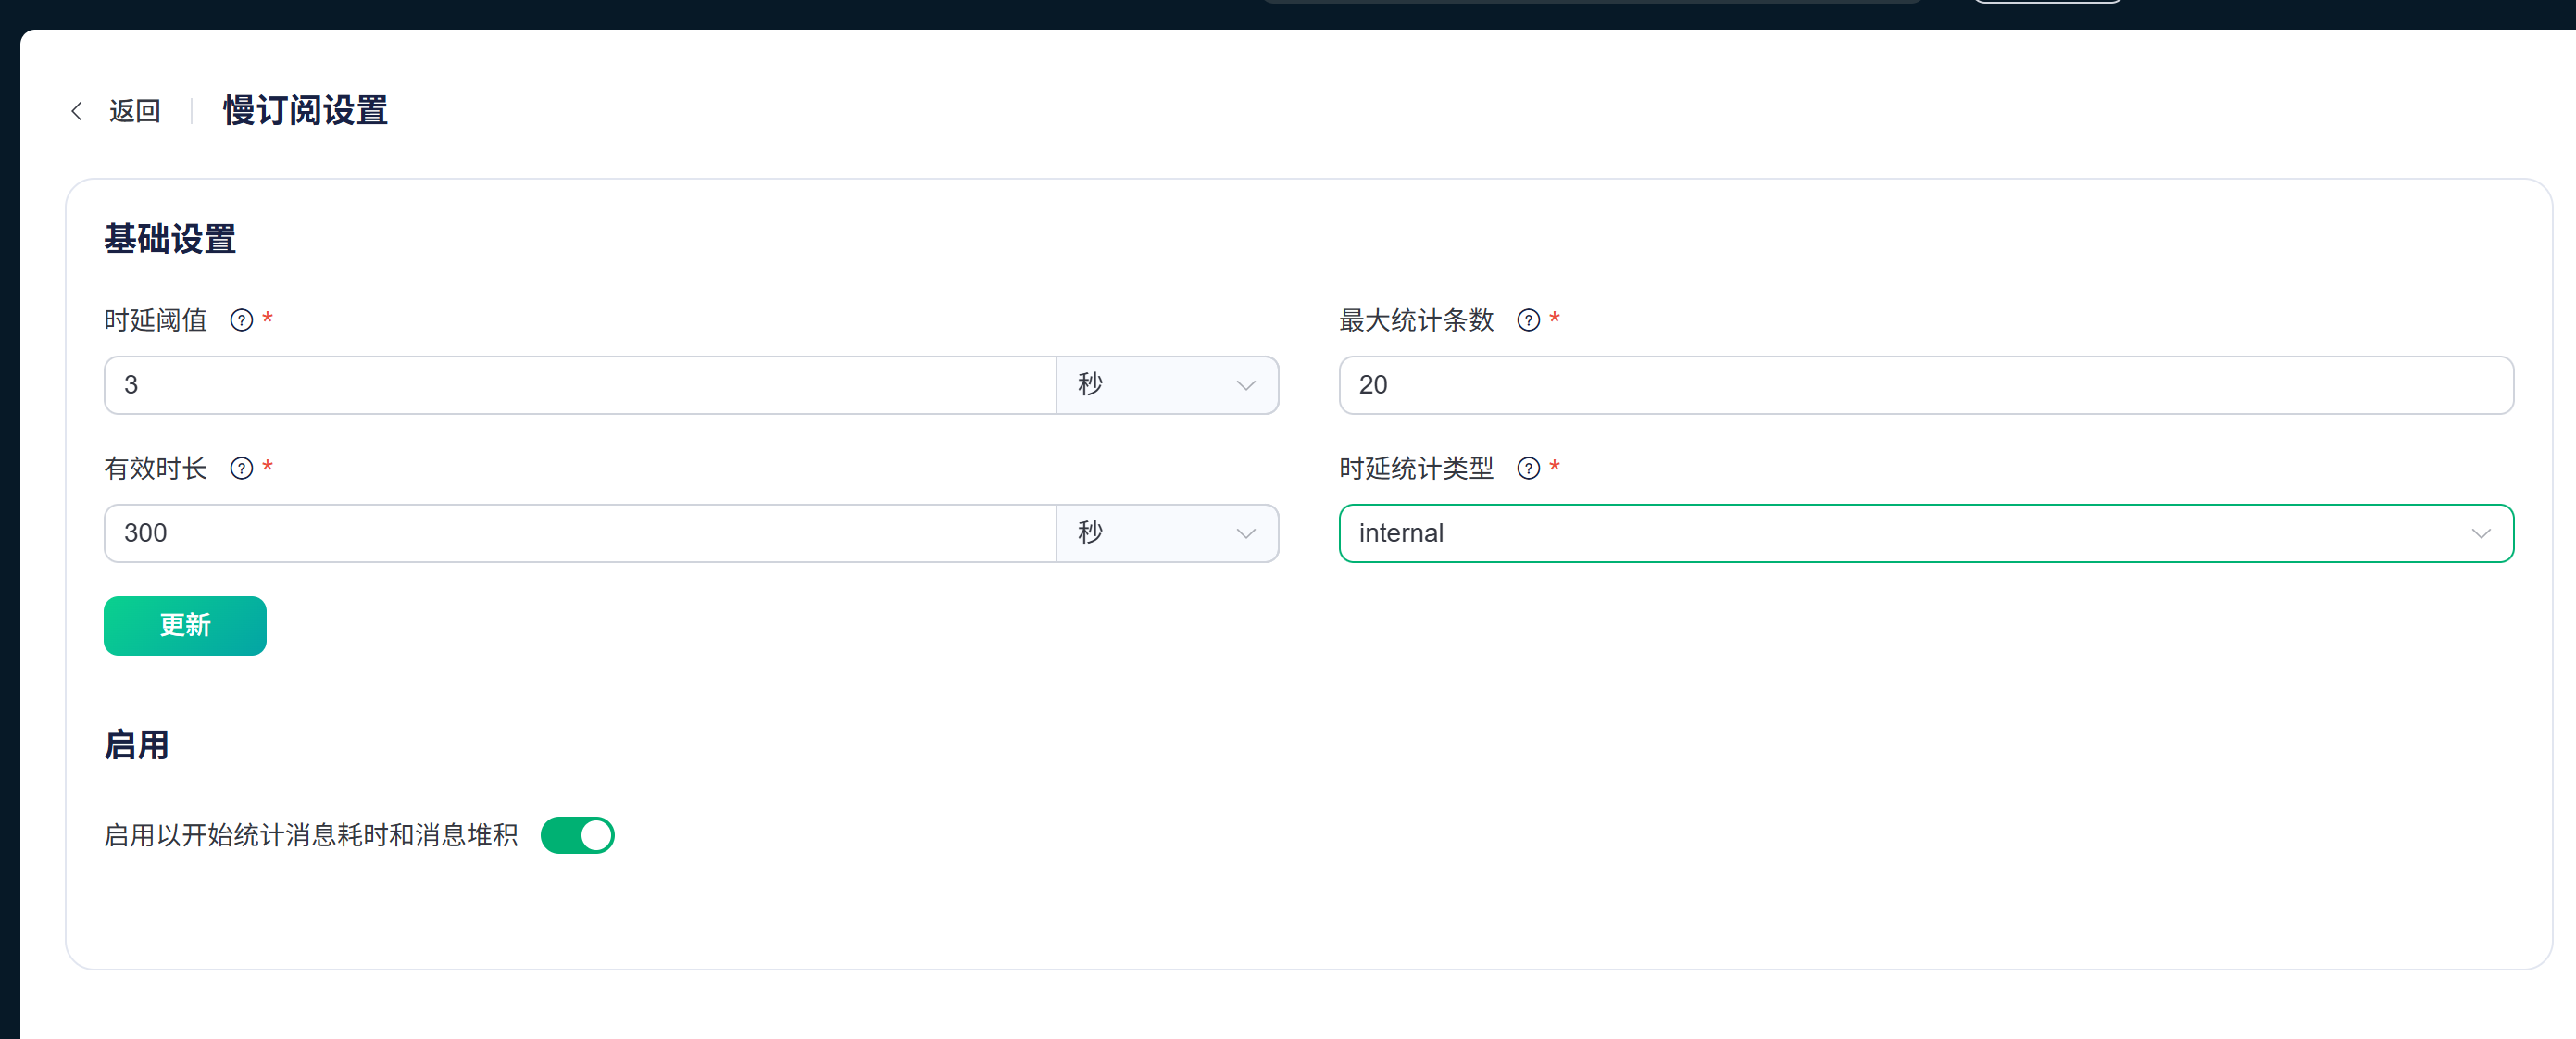
这是开慢订阅的规则,目前这样的情况下没有慢订阅客户端。

执行发消息前:
./emqx ctl broker metrics | egrep ‘bytes.sent|messages.qos2.sent|messages.acked|packets.pubcomp.(received|missed)|delivery.dropped|messages.dropped’
bytes.sent : 50406349592
delivery.dropped : 0
delivery.dropped.expired : 0
delivery.dropped.no_local : 0
delivery.dropped.qos0_msg : 0
delivery.dropped.queue_full : 0
delivery.dropped.too_large : 0
messages.acked : 7007719
messages.dropped : 95441
messages.dropped.await_pubrel_: 0
messages.dropped.no_subscriber: 95438
messages.qos2.sent : 20378913
packets.pubcomp.missed : 10364694
packets.pubcomp.received : 16800862

执行发消息后掉连接的时刻(我执行了多次的数据)
[root@XXX2-B09-DZYJ-9620-MG01 bin]# ./emqx ctl broker metrics | egrep ‘bytes.sent|messages.qos2.sent|messages.acked|packets.pubcomp.(received|missed)|delivery.dropped|messages.dropped’
bytes.sent : 50450470218
delivery.dropped : 0
delivery.dropped.expired : 0
delivery.dropped.no_local : 0
delivery.dropped.qos0_msg : 0
delivery.dropped.queue_full : 0
delivery.dropped.too_large : 0
messages.acked : 7050382
messages.dropped : 95447
messages.dropped.await_pubrel_: 0
messages.dropped.no_subscriber: 95444
messages.qos2.sent : 20528700
packets.pubcomp.missed : 10364694
packets.pubcomp.received : 16810760
[root@XXX2-B09-DZYJ-9620-MG01 bin]#
[root@XXX2-B09-DZYJ-9620-MG01 bin]#
[root@XXX2-B09-DZYJ-9620-MG01 bin]#
[root@XXX2-B09-DZYJ-9620-MG01 bin]#
[root@XXX2-B09-DZYJ-9620-MG01 bin]#
[root@XXX2-B09-DZYJ-9620-MG01 bin]#
[root@XXX2-B09-DZYJ-9620-MG01 bin]#
[root@XXX2-B09-DZYJ-9620-MG01 bin]#
[root@XXX2-B09-DZYJ-9620-MG01 bin]#
[root@XXX2-B09-DZYJ-9620-MG01 bin]#
[root@XXX2-B09-DZYJ-9620-MG01 bin]#
[root@XXX2-B09-DZYJ-9620-MG01 bin]#
[root@XXX2-B09-DZYJ-9620-MG01 bin]# ./emqx ctl broker metrics | egrep ‘bytes.sent|messages.qos2.sent|messages.acked|packets.pubcomp.(received|missed)|delivery.dropped|messages.dropped’
bytes.sent : 50470661713
delivery.dropped : 0
delivery.dropped.expired : 0
delivery.dropped.no_local : 0
delivery.dropped.qos0_msg : 0
delivery.dropped.queue_full : 0
delivery.dropped.too_large : 0
messages.acked : 7141225
messages.dropped : 95447
messages.dropped.await_pubrel_: 0
messages.dropped.no_subscriber: 95444
messages.qos2.sent : 20599515
packets.pubcomp.missed : 10438657
packets.pubcomp.received : 17001983
[root@XXX2-B09-DZYJ-9620-MG01 bin]# ./emqx ctl broker metrics | egrep ‘bytes.sent|messages.qos2.sent|messages.acked|packets.pubcomp.(received|missed)|delivery.dropped|messages.dropped’
bytes.sent : 50471048521
delivery.dropped : 0
delivery.dropped.expired : 0
delivery.dropped.no_local : 0
delivery.dropped.qos0_msg : 0
delivery.dropped.queue_full : 0
delivery.dropped.too_large : 0
messages.acked : 7141704
messages.dropped : 95447
messages.dropped.await_pubrel_: 0
messages.dropped.no_subscriber: 95444
messages.qos2.sent : 20600484
packets.pubcomp.missed : 10442122
packets.pubcomp.received : 17006427
[root@XXX2-B09-DZYJ-9620-MG01 bin]# ./emqx ctl broker metrics | egrep ‘bytes.sent|messages.qos2.sent|messages.acked|packets.pubcomp.(received|missed)|delivery.dropped|messages.dropped’
bytes.sent : 50471294920
delivery.dropped : 0
delivery.dropped.expired : 0
delivery.dropped.no_local : 0
delivery.dropped.qos0_msg : 0
delivery.dropped.queue_full : 0
delivery.dropped.too_large : 0
messages.acked : 7141705
messages.dropped : 95447
messages.dropped.await_pubrel_: 0
messages.dropped.no_subscriber: 95444
messages.qos2.sent : 20601003
packets.pubcomp.missed : 10442414
packets.pubcomp.received : 17006768


z这是whole类型。

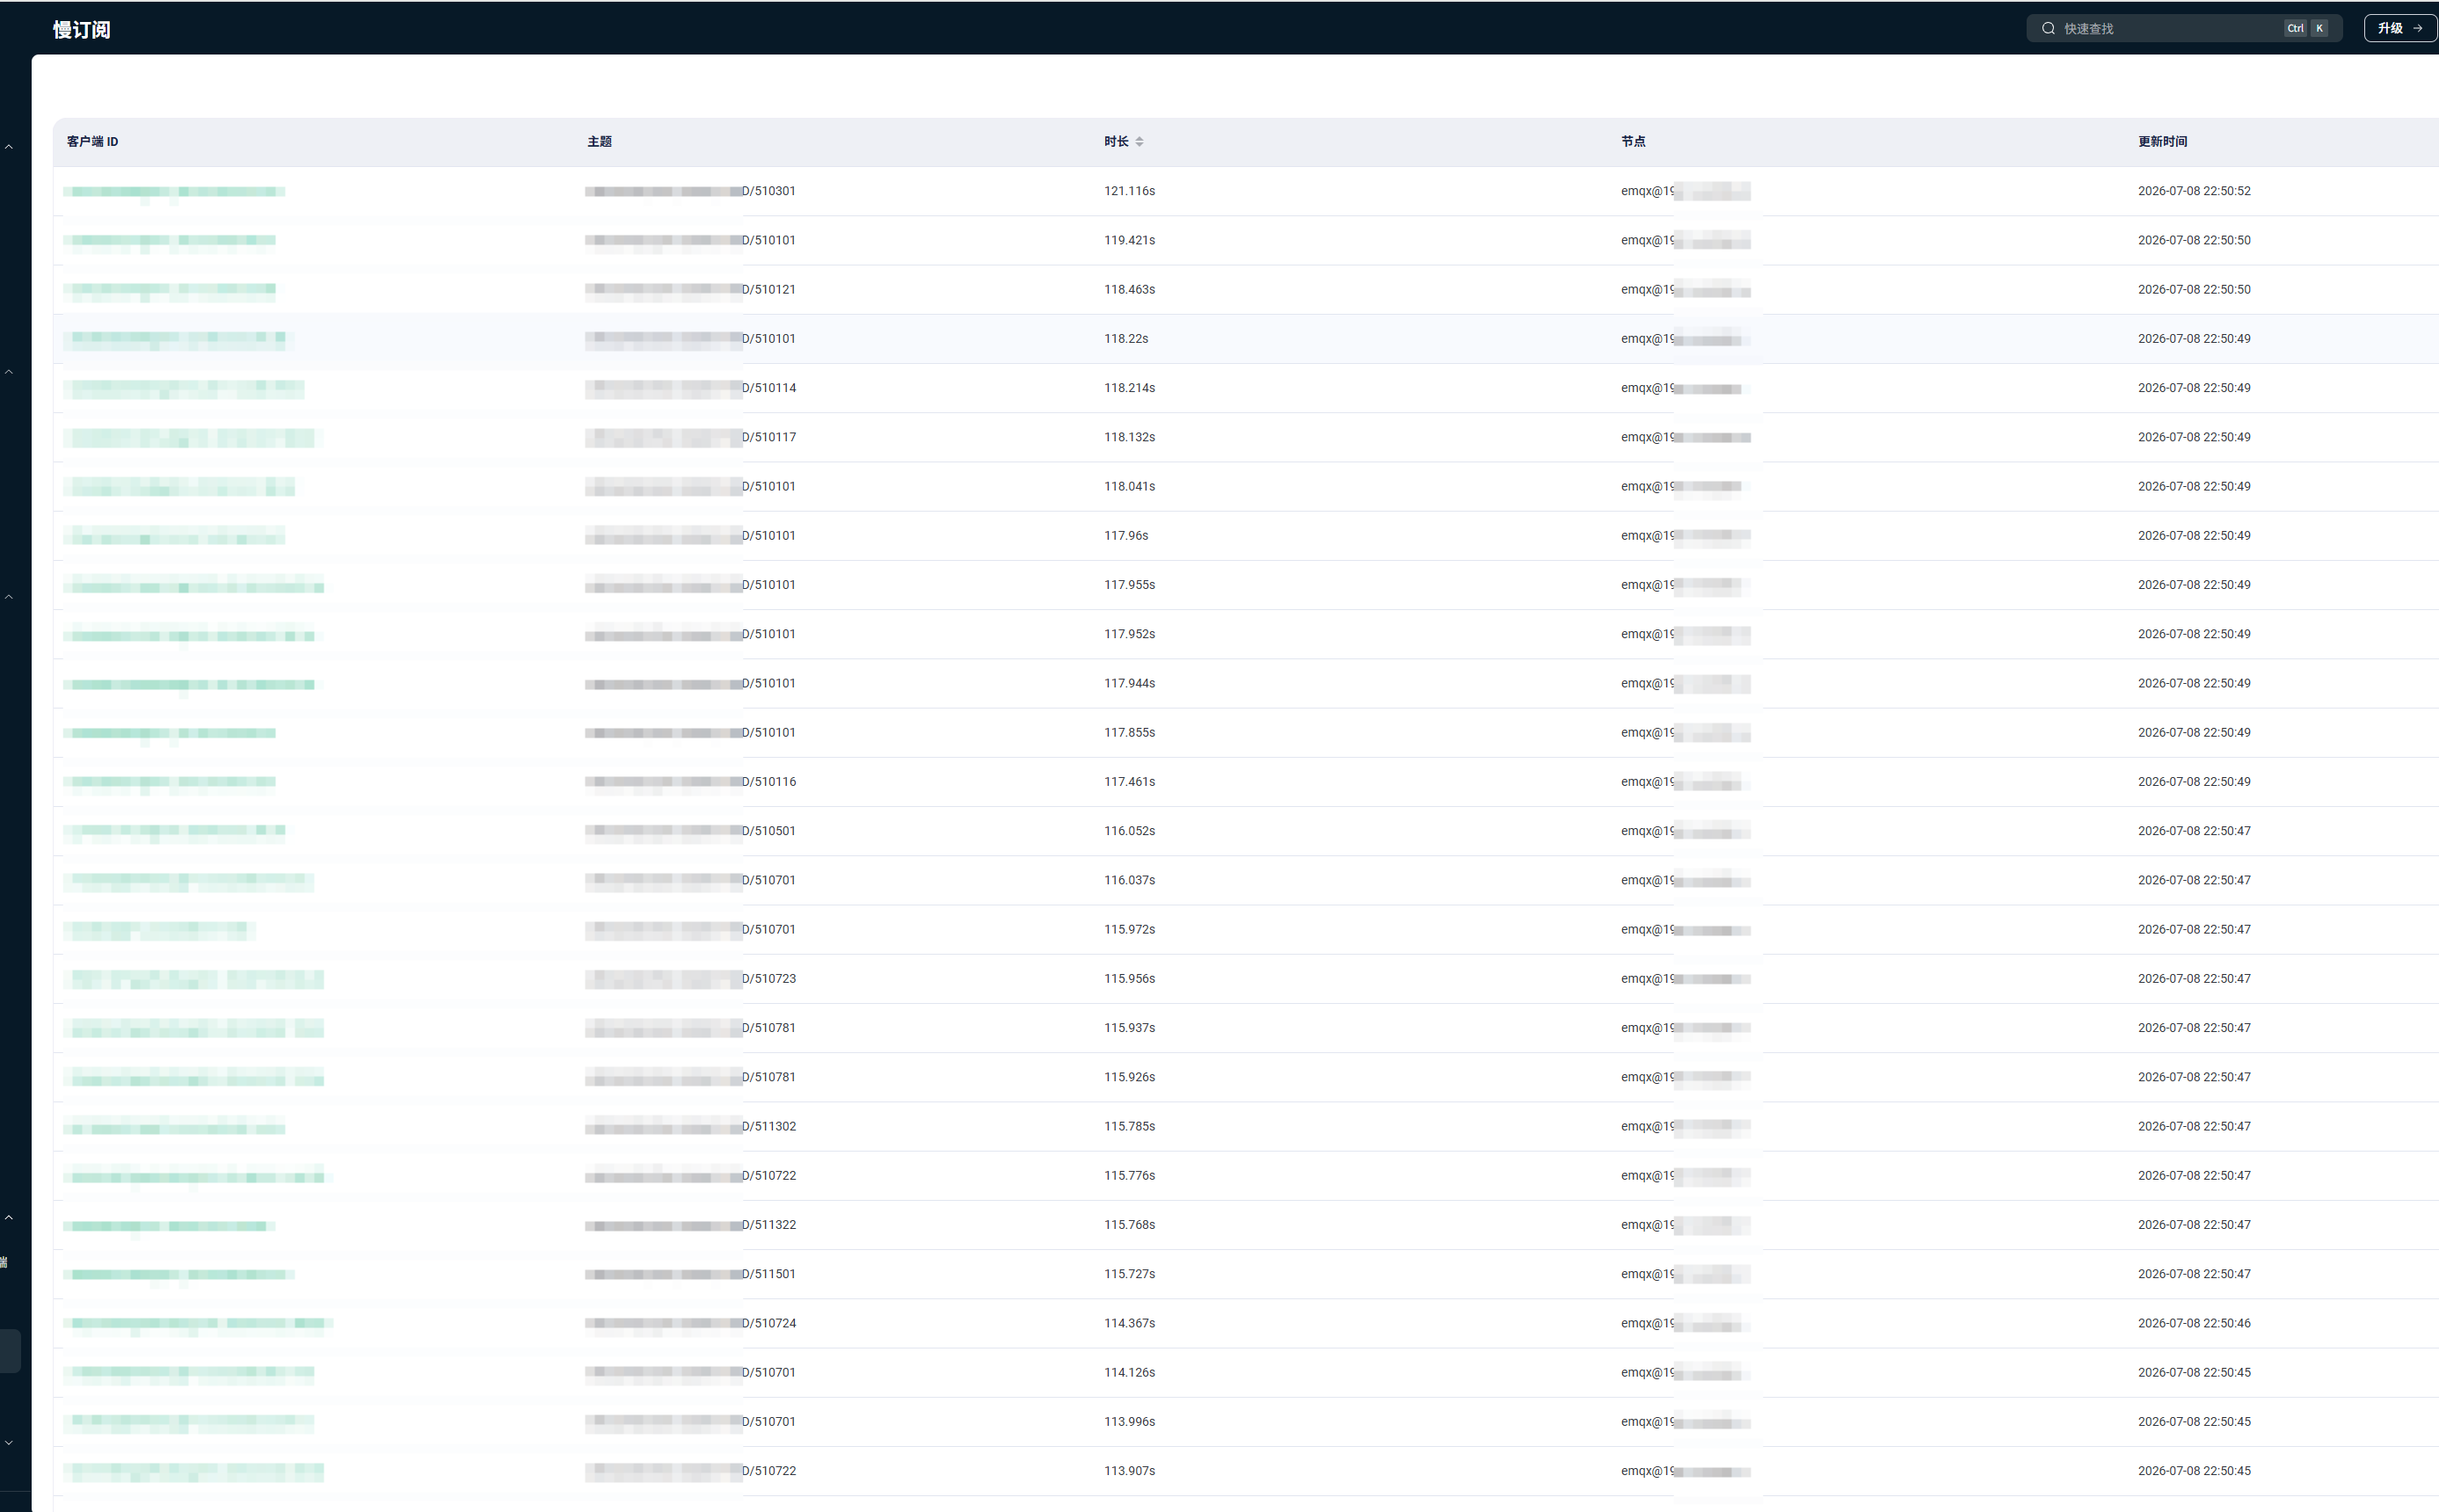
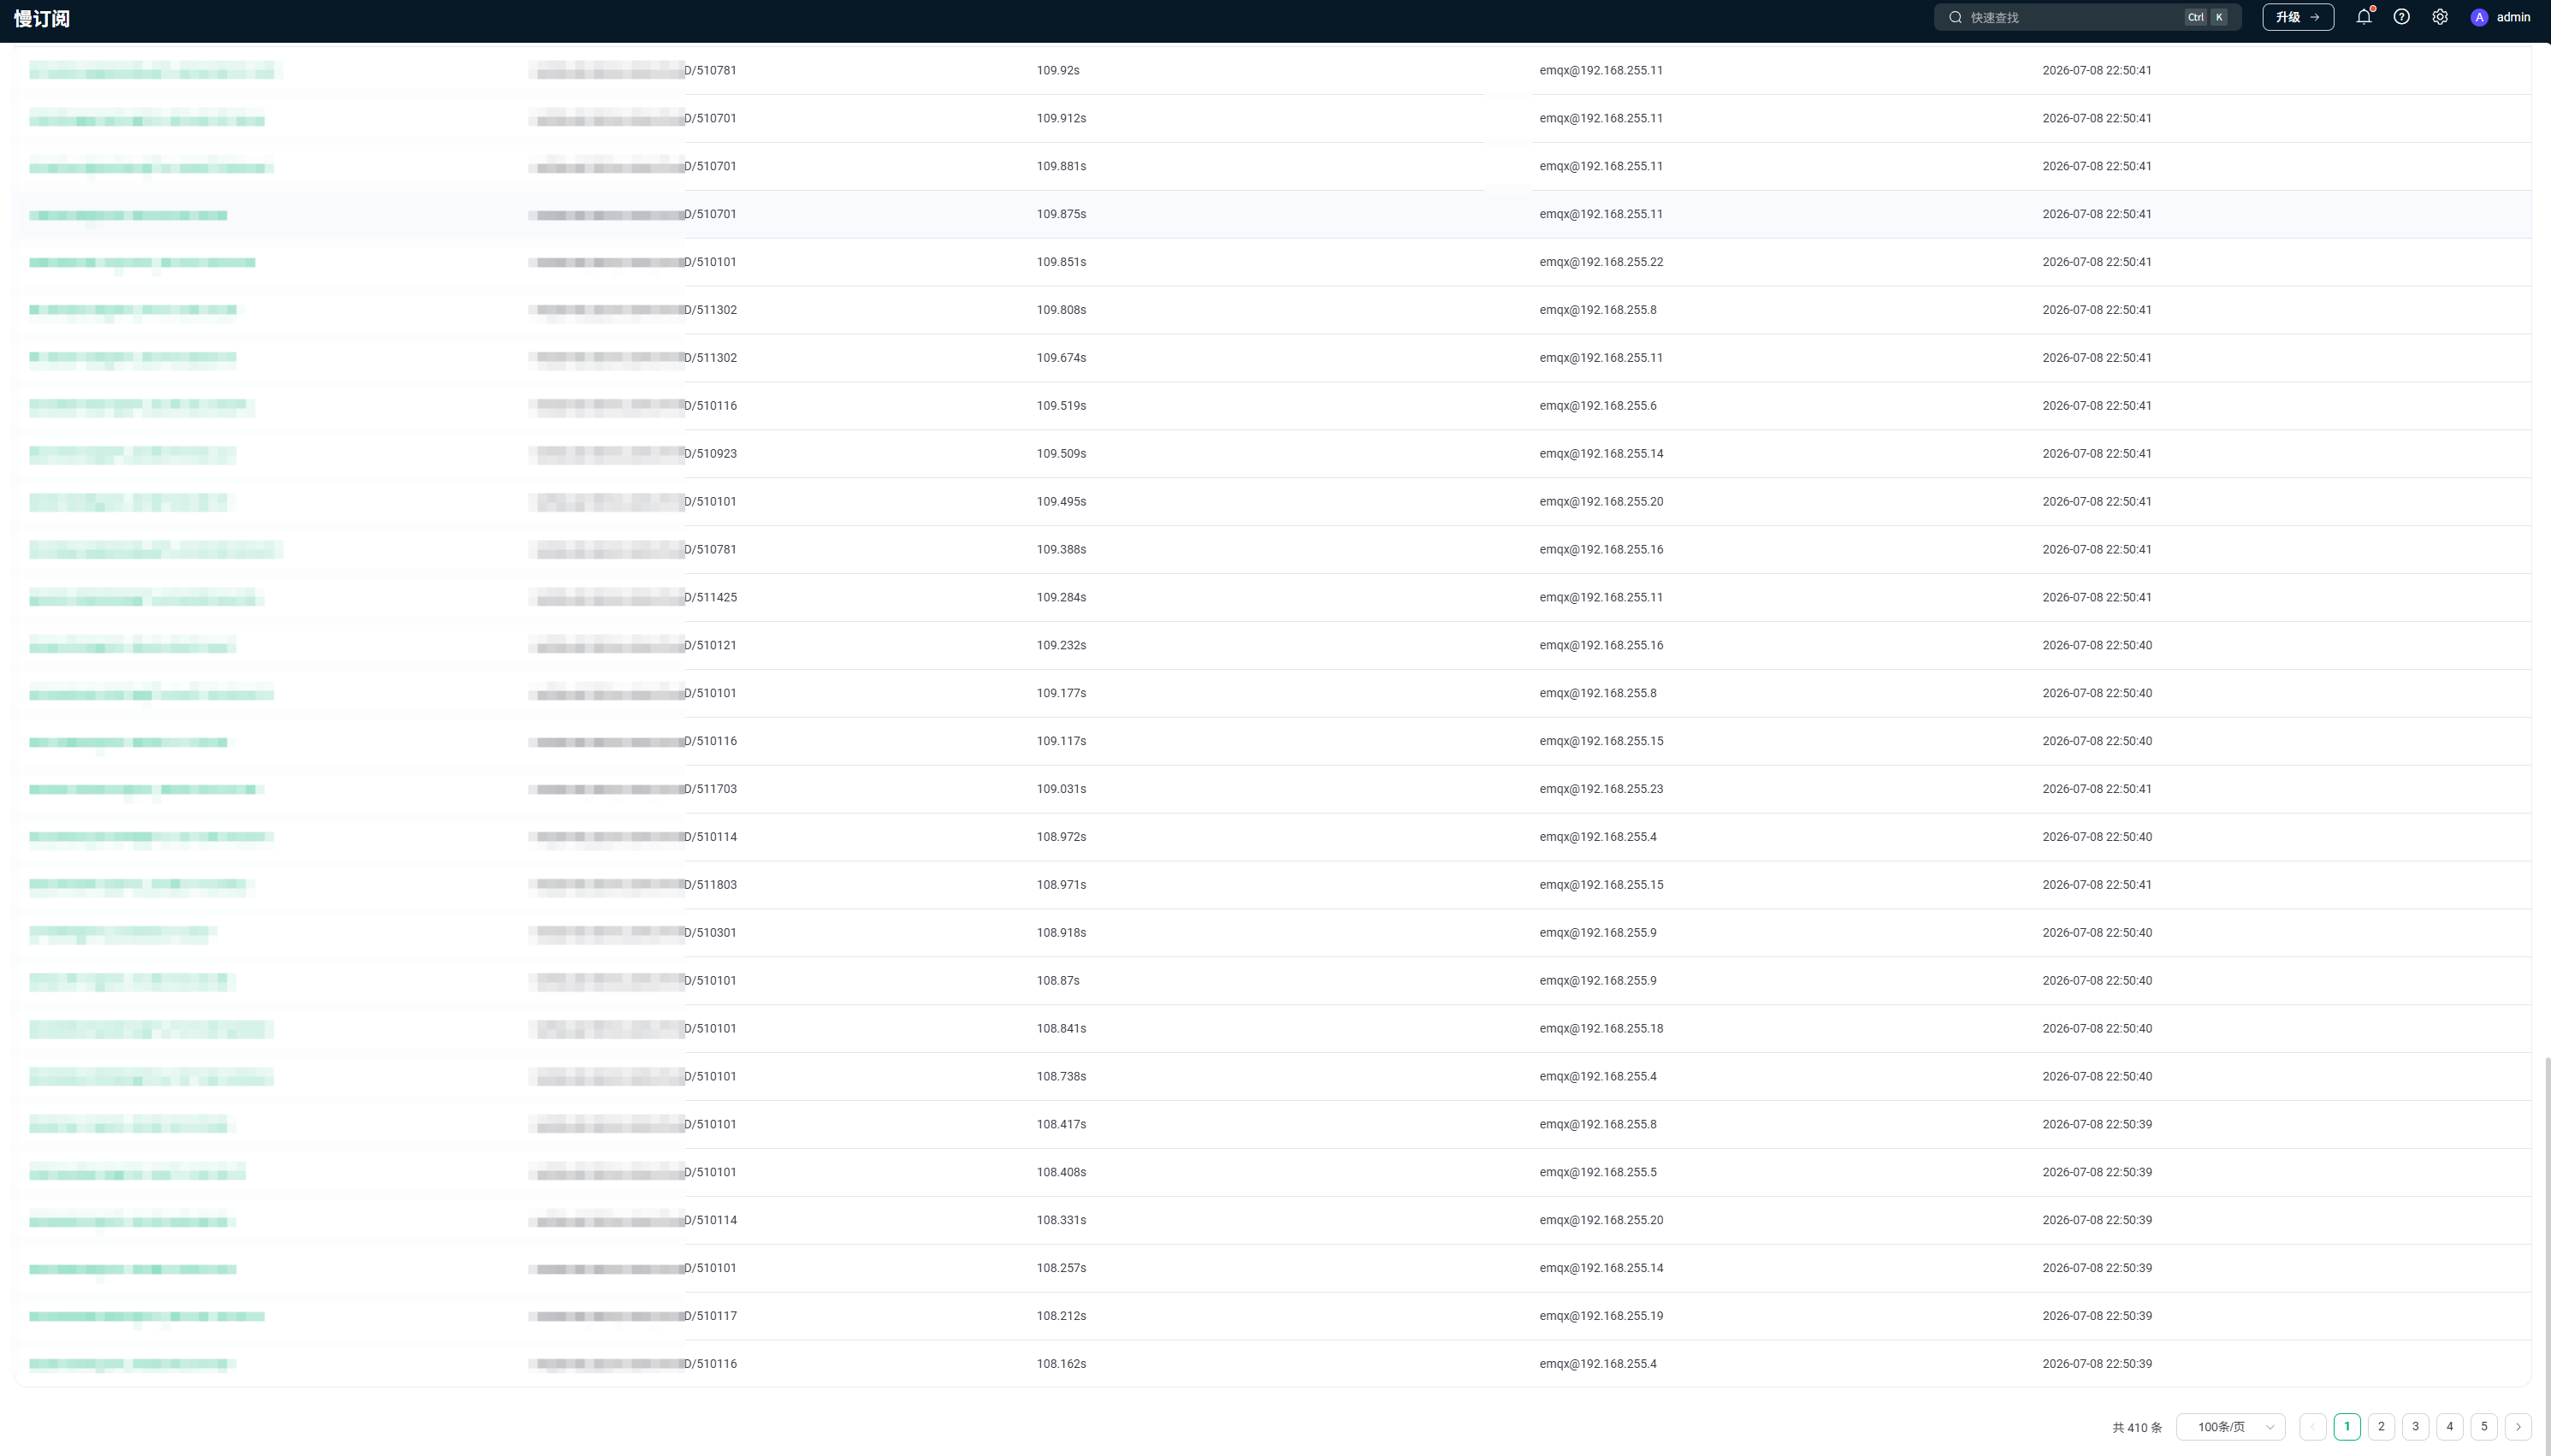
有很多慢订阅,这些慢订阅分布的又没有啥规则的感觉

这组数据可以可以排除队列丢消息的原因了,确定原因应该是 QoS2 fanout 后投递完成太慢,连接在完成确认前被断开/重建了。

这次的增量大概是:

messages.qos2.sent       +222090
messages.acked           +133986
packets.pubcomp.received +205906
packets.pubcomp.missed    +77720
delivery.dropped         +0
messages.dropped         +6
bytes.sent               +64.9 MB

delivery.dropped=0messages.dropped 基本没涨,说明不是 EMQX 主动把下行队列丢了packets.pubcomp.missed 涨得多,说明有一批 QoS2 完成包回来时,连接/会话里的 packet id 状态已经对不上了;常见路径是 TCP 连接已经被关掉、重连、会话切换后再收到旧 PUBCOMP

慢订阅也对上了。internal 没记录,whole 有 100s+ 的一大片,说明主要耗时不是路由/匹配/内部投递前逻辑,而是从开始投递到 QoS2 完成这段。结合前面的 busy_port tcp_inet,方向还是 socket 写出、客户端/LB、QoS2 ACK 链路。

“分布没规律”也算正常。因为是一次广播把很多连接同时推到慢路径上,所以 topic、clientId、节点会散开。,不是某几个固定慢客户端把系统拖死。

下一步:

  1. 慢订阅统计类型改成 response,阈值还是 3s,最大统计条数先调到 1000,再复现一次。response 也有大量记录,就可以直接按客户端响应/网络出口方向处理。
  2. 把断开原因按节点聚合出来,不要只看截图。如果 $events/client/disconnected 已经落库,就按 reason,node 聚合;没落库就先按日志统计 tcp_closed / keepalive_timeout / kicked / discarded / takeovered 的数量。

如果主要还是 tcp_closed,优先查客户端侧处理线程、LB idle/read timeout、出口带宽/丢包,以及发布端 burst。折中方案还是先限速/分批;业务允许的话,广播 QoS2 降到 QoS1,用业务幂等保证最终效果。

这边查询百分之90都是reason_code:tcp_closed


这个1883是emqx的连接端口,其中使用netstat -lntp 的时候会卡一会,跟这个有没有关系呢