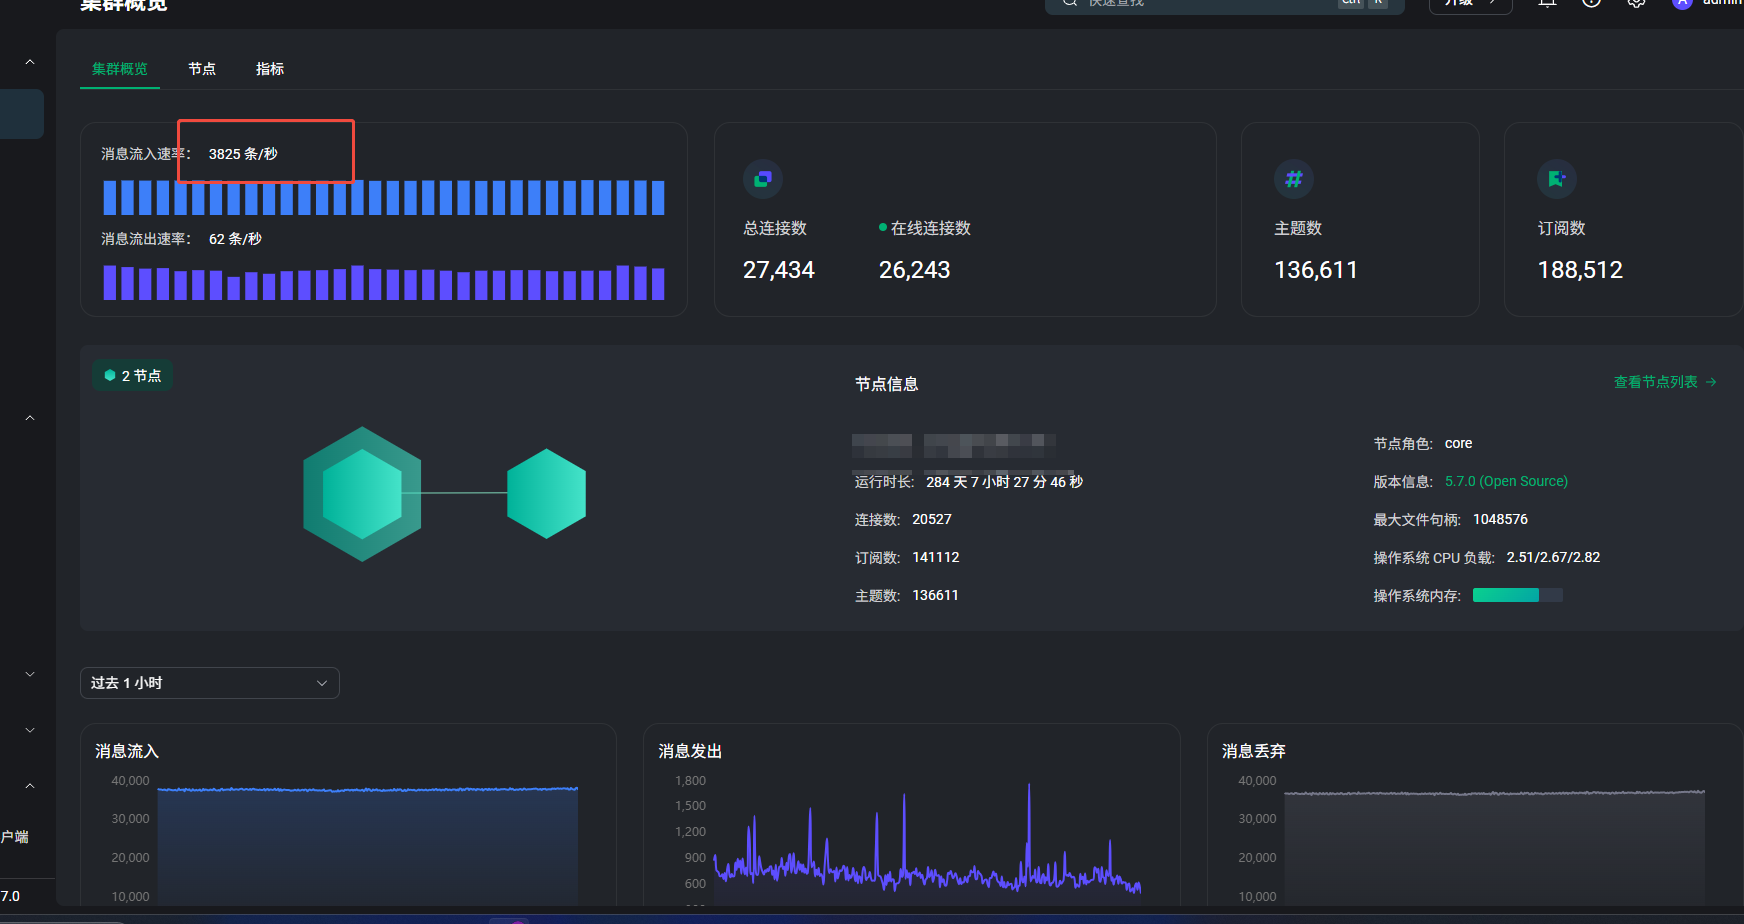
在EMQX Dashboard中显示消息每秒流入3800,但我通过debug日志收集10分钟的日志不到30万条,平均每秒为500左右,想要咨询下原因
这个差异多数是“口径不同”导致的,不一定是计数错。
Dashboard 的消息流入速率看的是 broker 侧指标(messages.received 的变化速率);你用 debug 日志统计通常只覆盖了某一类日志、某一个节点、且日志本身可能限流/采样,所以会明显偏小。
先做一组同口径对比(同一节点、同一时间窗 600s):
# t0
curl -s -u admin:*** http://127.0.0.1:18083/api/v5/stats | jq .messages.received,.messages.qos0.received,.messages.qos1.received,.messages.qos2.received
# 等 600 秒
# t1
curl -s -u admin:*** http://127.0.0.1:18083/api/v5/stats | jq .messages.received,.messages.qos0.received,.messages.qos1.received,.messages.qos2.received
用 (t1 - t0) / 600 算平均速率,再和 Dashboard 对照。
还有两点:
- 你是单节点还是集群?如果是集群,Dashboard 显示集群汇总,而你日志只看了单节点。
- 你统计日志时匹配的关键字是什么?贴一下 grep 条件 得对齐到
messages.received口径。
统计的时候已经考虑到了集群的问题
日志文件都不用grep, 一共就不到30万行
没有messages.received
{“node”:“emqx@******”,“subscribers.max”:152070,“subscribers.count”:136121,“subscriptions.max”:151393,“subscriptions.count”:135609,“suboptions.max”:151393,“suboptions.count”:135609,“channels.count”:19448,“channels.max”:21741,“sessions.count”:19448,“sessions.max”:21741,“connections.count”:19448,“connections.max”:21741,“live_connections.count”:19336,“live_connections.max”:21613,“cluster_sessions.count”:25847,“cluster_sessions.max”:27515,“topics.max”:137076,“topics.count”:129116,“subscriptions.shared.max”:0,“subscriptions.shared.count”:0,“retained.count”:140823,“retained.max”:140823,“delayed.max”:0,“delayed.count”:0}]
不好意思搞错了,你这个返回是统计项(stats/gauge),不是消息计数器(metrics/counter),所以看不到 messages.received,
curl -s -u admin:*** http://127.0.0.1:18083/api/v5/nodes/emqx@节点名/metrics | jq .messages.received,.packets.publish.received
另外,debug 日志条数本身不能代表真实消息数,常见偏差点有两个:
- 日志只覆盖部分事件(不等于每条 PUBLISH 一条日志)。
- 日志级别/采样/限流会让高峰期日志明显偏少。